
- Remittance
- Exchange Rate
- Stock
- Events
- EasyCard
- More
- Download


Illusion vs. Reality—Has the U.S. Stock Market Really Crashed?

Published on 2024-08-13 Updated on
2024-11-05


Last Monday, due to disappointing financial reports from large technology companies, unexpectedly weak economic data, and the failure of trading strategies pegged to the yen, US investors fell into extreme panic, which also led to a sell-off in the US stock market last Monday, with the three major indexes falling sharply.
The July employment report was significantly lower than expected. The data showed that the US economy added 114,000 new jobs and the unemployment rate rose from 4.1% to 4.3%. More seriously, the unemployment rate triggered the famous recession indicator - Sam’s rule, which performed perfectly in past US economic recessions.
At that time, everyone was discussing the panic decline of the US stock market and how Wall Street would respond to the economic “hard landing”.
Many people believe that due to the support of US economic policies, the US economy and stock market, which have been booming in recent years, are about to start a recession. Even many economists have been “looking forward to” this recession for a long time.
Since the Federal Reserve began significantly raising interest rates in 2022, it has kept interest rates between 5.25% and 5.5% in the past year. The Federal Reserve’s goal is very clear, which is to reduce inflation while avoiding a recession and achieving a soft landing for the economy.
However, the expected recession of the US economy has caused panic in the market. Investors are calling for an emergency interest rate cut from the Federal Reserve and criticizing the slow response of the Federal Reserve, which has brought the US economy to this point.
Various words such as “collapse” and “explosion” have appeared on media and social media platforms in various countries.

Last Thursday’s economic data ended the topic of the US economic recession.
Data released by the US labor department last Thursday showed that the number of initial jobless claims decreased by 17,000 people in the previous week, only 233,000 people, a sharp drop from the highest level in 11 months set just the previous week.
Chris Zaccarelli, Chief Information Officer of the Independent Consultants Alliance, immediately stated in a report that the initial jobless claims data “may provide a boost to the market”.
The signs of slowing economic growth are obvious to everyone who is paying attention, but considering that the growth rate of US GDP still reaches 2.8%, it is difficult to believe that an economic recession has begun. We are acting cautiously, but believe that the panic that began earlier this month has been exaggerated.
The US stock market immediately began a violent rebound mode last Thursday, with the S & P 500 index rising 2.3%, setting the best single-day performance in nearly two years.
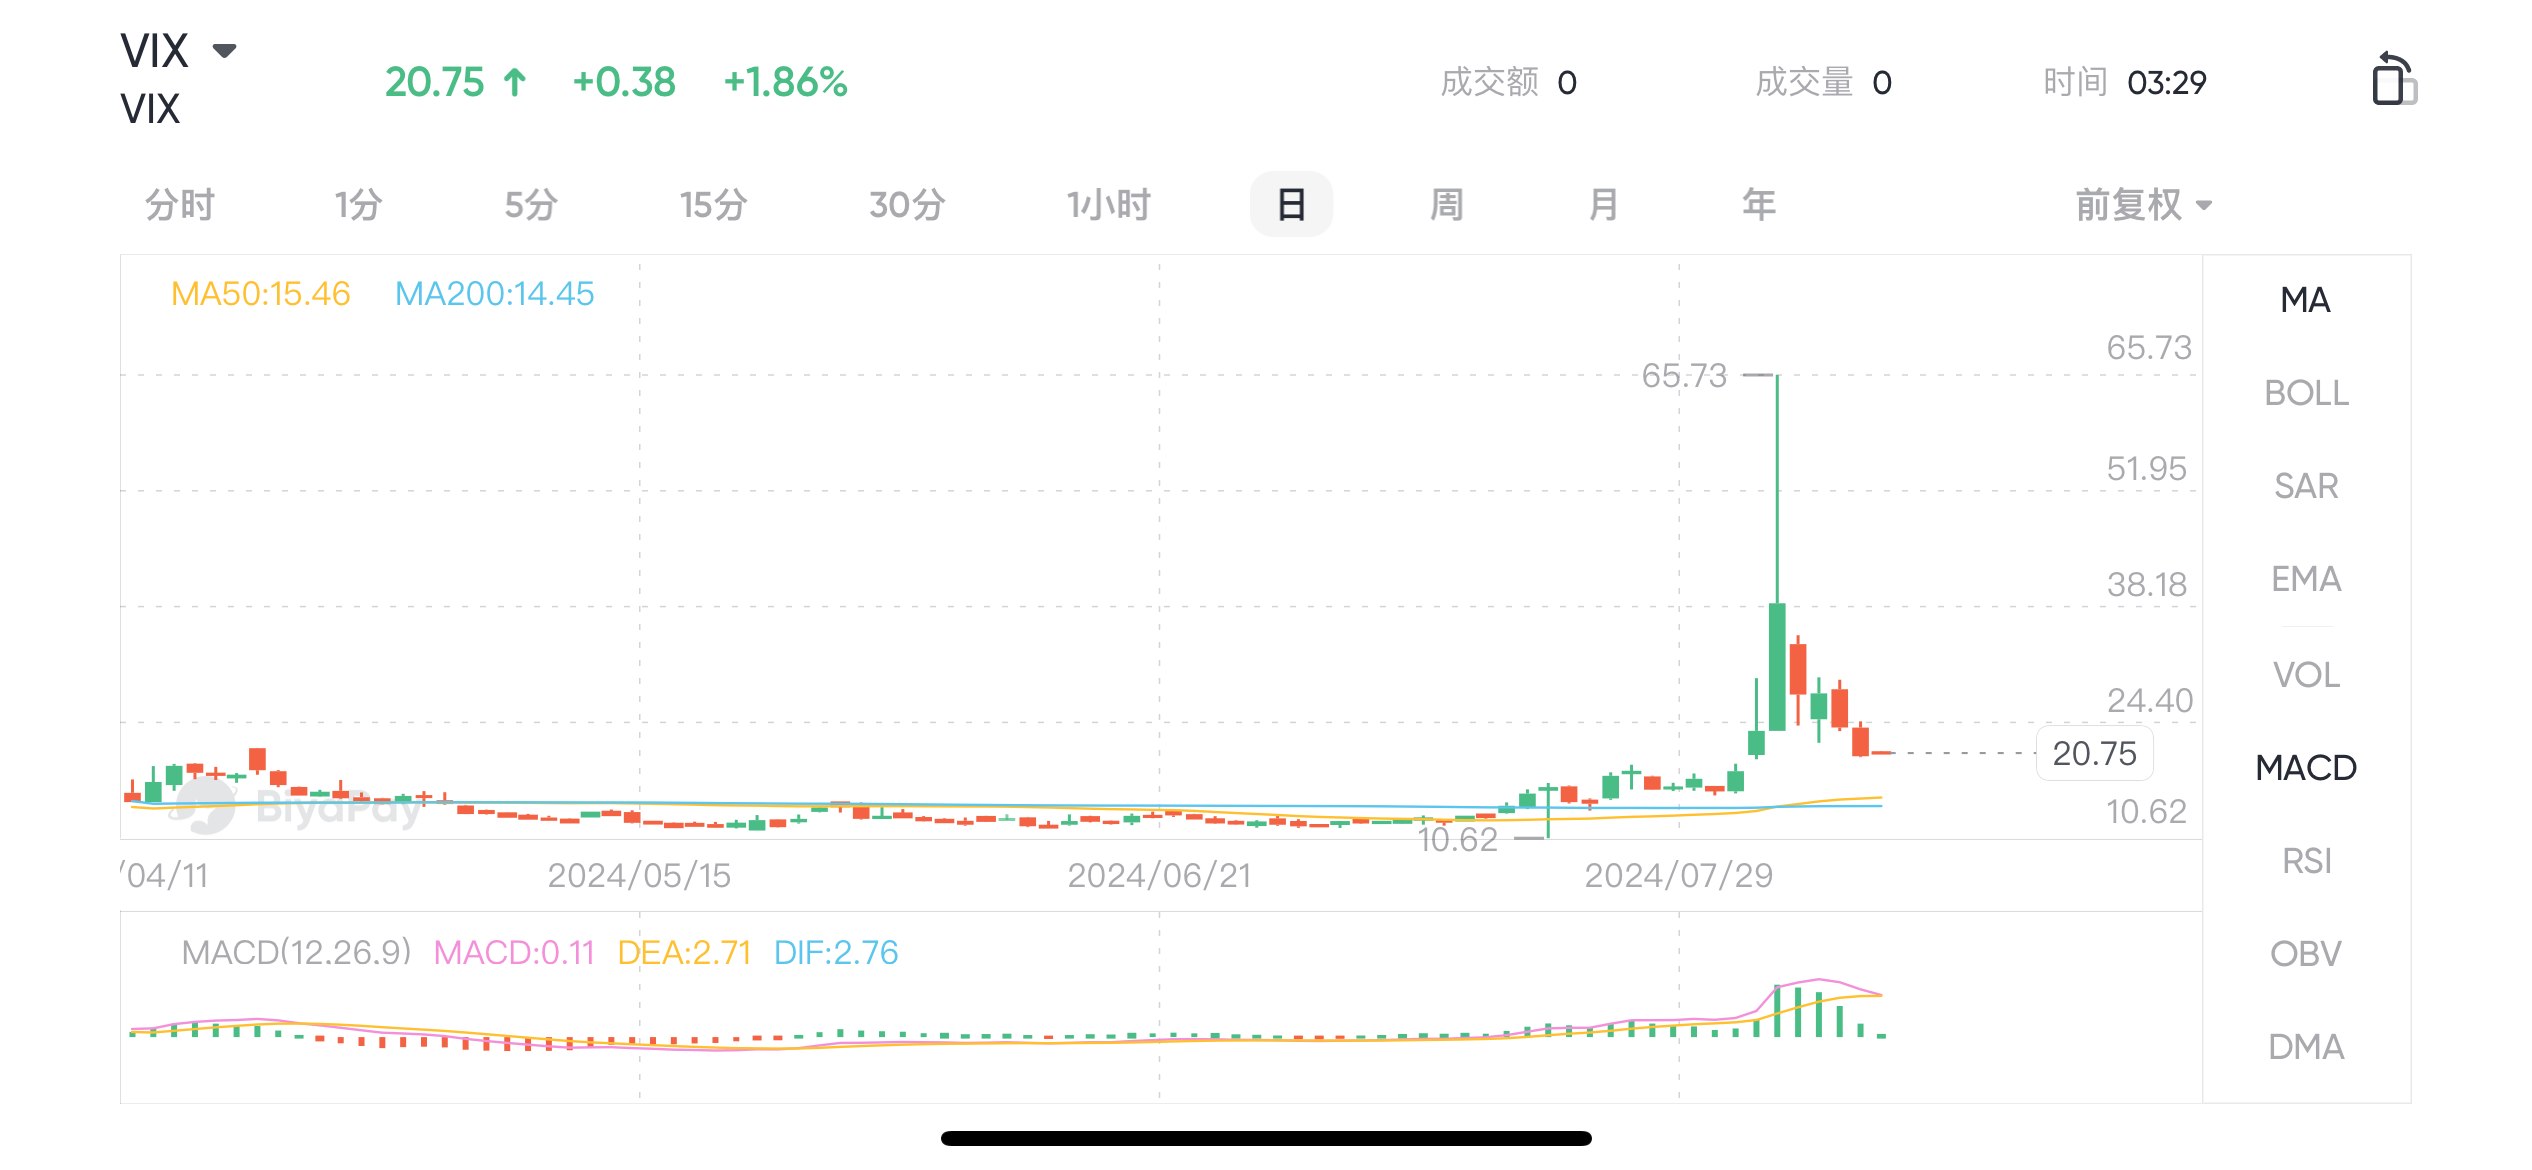
Looking back at the end of last week, except for the panic index VIX, which represents the stock market sentiment barometer, which did a roller coaster ride, the S & P 500 and Nasdaq remained basically unchanged. Now, the VIX has also fallen from its high point this year to near its long-term average.
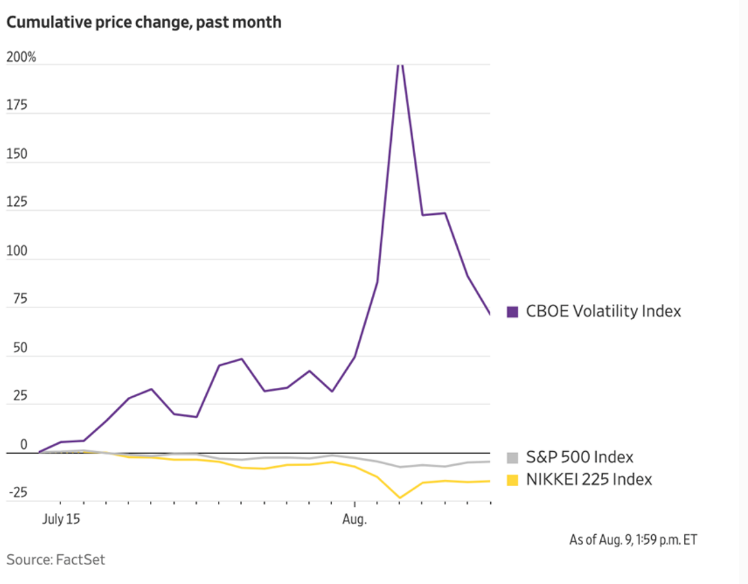
What is VIX?
The Chicago Board Options Exchange Panic Index (VIX), also known as the “Panic Index”, is a market index created and maintained by the Chicago Board Options Exchange (CBOE). VIX measures the implied volatility of S & P 500 options and is one of the widely used risk indicators in global markets. As VIX reflects investors’ expectations for stock market volatility over the next 30 days, it is considered a barometer of market sentiment.
When the VIX volatility index rises, it usually means that investors expect the market to face greater volatility and increased risk, hence it is called the “panic index”. Conversely, when the VIX volatility index falls, it indicates that market sentiment is relatively stable and investors expect less volatility in the future.
Risk management tools
Investors and institutions often use VIX for risk management. By trading VIX futures, options and other derivatives, investors can hedging market risks or taking advantage of volatility changes for arbitrage trading.
Forecast market trends
Although VIX is essentially a volatility indicator, its trend is often closely related to market trends. For example, before a market crash, VIX usually rises, reflecting the rise of market panic.
How to trade VIX
VIX futures: CBOE offers VIX futures contracts that allow investors to trade the VIX volatility index to manage expectations of market volatility.
VIX options: Investors can also trade through VIX options and profit from volatility strategies.
VIX ETFs: Some exchange-traded funds (ETFs) are built on the VIX volatility index, and investors can indirectly invest in the VIX volatility index through these ETFs.
On some US stock and derivative trading platforms, such as Tiger Securities, BiyaPay, and Futu Securities, you can trade the VIX volatility index.
Media noise
As an investor, the first step in cultivating self-discipline is to take a minute to think about what the media wants you to see and what the actual data is. Columnist Jason Zweig gave two examples.
- News headline “Dow Jones index drops 1000 points in a single day”. It may seem scary, but even those who do not invest in US stocks only need to look at the denominator behind it to find that the Dow Jones index closed at 39,737.26 the day before yesterday. In other words, the “terrible” drop of 1000 points in a single day is only a 2.6% drop. Of course, the 2.6% daily drop is slightly larger than the relatively calm market in the past period, but does it sound much better than “1000 points”?
- On August 5th, social media reposted one after another: "Shocking! US individual investors sold $1 billion stocks in a single day."
It sounds like investors in the US have lost confidence in the market and the economy and are selling for safety. But what about the truth? We only need to put it in a data context to quickly understand what’s so great about this $1 billion. According to the official website of the US Statistics Bureau, there are about 130 million households in the US. According to the survey data of the Federal Reserve, about 58% of households in the US own stocks through various funds, ETFs, direct investments, etc. That is to say, about 130 million * 58% = 75 million households own stocks. Assuming this $1 billion data is correct, 1 billion/75 million households that own stocks have “sold” an average of $13 worth of stocks. According to the Federal Reserve, the median amount of stocks owned by US households is 52,000 dollars, which means that on August 5th, the average US household sold $13/5.2 million = 0.025% of their stocks. It’s really amazing!
We have also seen some similar cases in the past week and would like to share two of them with you:
- News headline: “Recession panic detonates’Black Monday ‘, tech 7 sisters’ initial market value evaporates collectively by $1.30 trillion”. 1 trillion The sudden evaporation of the US dollar is really amazing, but if you spend a second, you will find that the overall market value of the S & P 500 index where the tech 7 sisters are located is about 45 trillion. The US stock market that has been well-known to domestic investors in the past two years is the tech 7 sisters. Therefore, from the perception of Chinese media, the US stock market can be equated with the tech 7 sisters. However, there are thousands of Listed Companies in the US stock market, more than 2,200 on the NYSE, and more than 3,400 on the NASDAQ. In addition to the 7 sisters, there are also 493 companies in the S & P 500, covering various industries. Tech stocks are not the same as the entire market
- News headline: “US credit card debt breaks record, reaches $1.14 trillion, experts say people can’t make ends meet.” This news is based on the latest data released by the Federal Reserve for the second quarter, and also invited “experts” to comment, from major US financial media. It seems very credible. Even attached is a chart of the Federal Reserve (as shown below), the US people are indeed living in dire straits, where is the soft landing, clearly the economy is about to collapse.
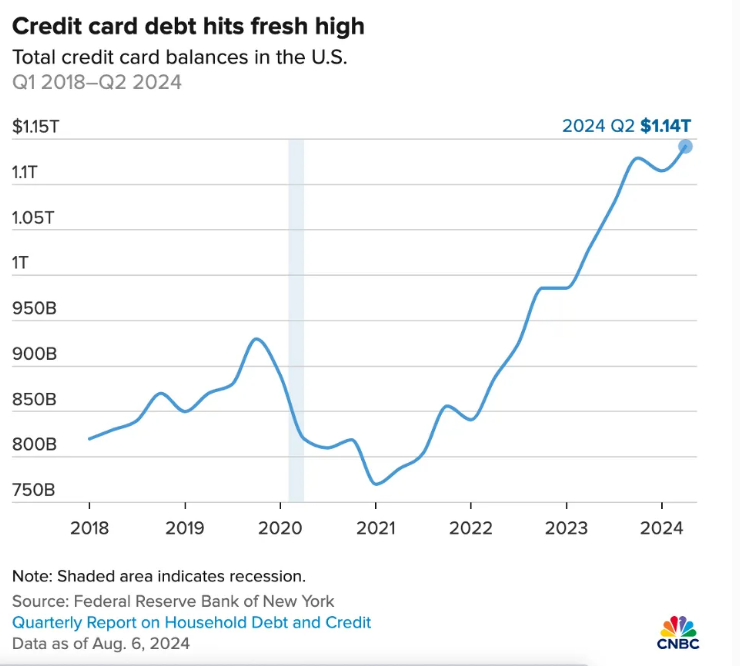
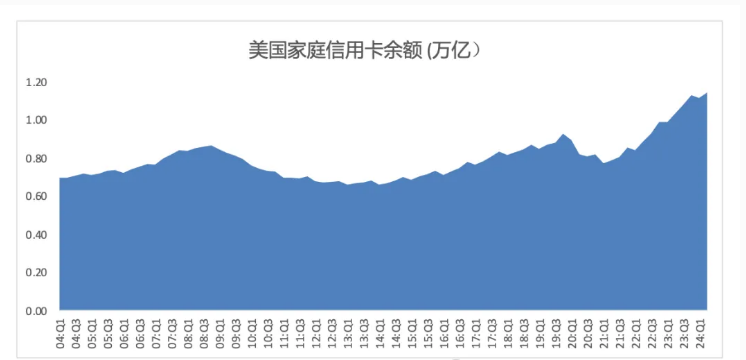
Just by looking at the horizontal axis, you will find that the starting point of this graph is 2018, so the center of the graph is the three years of the epidemic. During the three years of the epidemic, the US government spent money, and the credit card debt of the people showed a significant decline. From 2021 to now, there has been a sharp rise in credit card debt. Looking at the vertical axis again, the starting point is 750 billion, not 0. Drawing the graph like this, of course, looks more amazing. The data from the Federal Reserve did not start in 2018. The following graph is from the original data source of the Federal Reserve, from the first quarter of 2004 to the second quarter of 2024. Has credit card debt reached a historical high? Yes. But just correcting the horizontal and vertical coordinates, does it not look so “dire”?
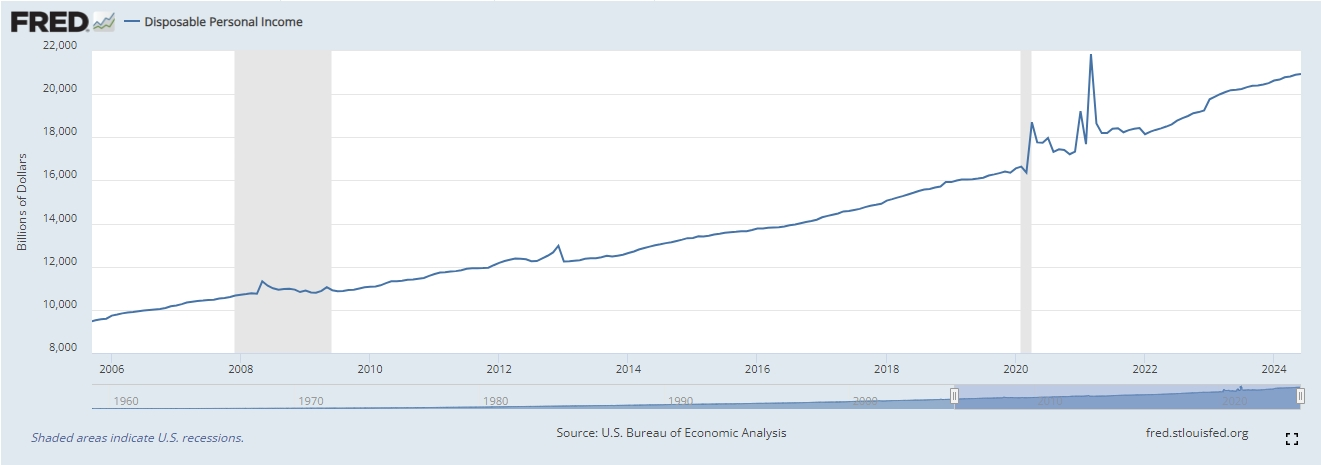
If we add another chart and take a look at the growth of Disposable Income among US citizens during the same period, the data source also comes from the Federal Reserve. It turns out that during the same period, income growth also looked very impressive.
Do a simple calculation,
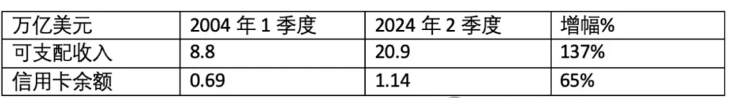
From 2004 to 2024, US residents’ Disposable Income increased by 137%, while credit card balances increased by 65% during the same period. It doesn’t seem to be that difficult.
The four examples mentioned in this article all happened in the first week of August 2024. In just one week, there were so many seemingly correct and terrifying small articles that were actually just eye-catching, and we were talking about articles that cited correct data, not to mention those purely small essays.
Clear the fog
In the era of information explosion, investors face a large amount of complex and even contradictory information, especially on financial media and social platforms. Therefore, how to break through the media fog and move towards rational investment has become a key challenge for many investors. Here are some effective strategies and methods.
-
Focusing on long-term investment
Financial Marekt is full of volatility, and the media often magnifies short-term market fluctuations, creating anxiety or excessive optimism. Focus on long-term investment goals and strategies, not be disturbed by short-term market fluctuations. Choose companies with long-term growth potential for investment, focus on analyzing the company’s fundamentals, rather than short-term market sentiment fluctuations.
-
Establish your own investment principles
Develop a clear investment plan based on personal financial situation, risk tolerance, and long-term goals, and strictly follow it. Reduce the risk of a single asset or market volatility by diversifying investments. Avoid investing all funds in a single stock or industry.
-
Filter information and focus on important content
When obtaining information, you can use tools such as RSS and email subscriptions to filter out useful and trustworthy sources of information. Focus on fundamental factors such as the company’s financial statements, industry development trends, macroeconomic indicators, rather than market rumors or media hype.
Recommended tools,

Bloomberg Terminal
Bloomberg Terminal is a tool widely used by financial professionals worldwide, providing real-time data, news, analysis tools, and research reports. It supports trading of various asset classes such as stocks, bonds, forex, futures, etc. Powerful Data Analysis and Visualization capabilities, global market coverage, real-time news, and research reports.

Yahoo Finance
Yahoo Finance is a free online tool that provides real-time data, news, analysis, and portfolio tracking functions for markets such as stocks, bonds, and commodities. It has a user-friendly interface, extensive market data coverage, and is free to use.

Zacks Investment Research
It provides stock research reports, rankings, and recommendations to help investors identify potential stock investment opportunities. Its rating system is a widely used reference standard for investors. It provides stock ratings, research reports, and investment advice.
-
Utilize professional platforms and tools
If you are unsure of your analytical ability, using professional platforms and tools can provide you with accurate information, neutral data, and develop a reasonable investment strategy.
Recommended tools,

TradingView
- Function : TradingView is a web-based charting tool that supports technical analysis, market research and social trading. Users can create and share charts and track real-time market data.
- Features : Powerful charting capabilities, social trading networks, extensive market coverage.

BiyaPay
- Function: Professional global multi-asset trading wallet, can trade US and Hong Kong stocks, low trading fees, support financing and short selling. It also supports cross-border transfer of multiple currencies, allowing users to easily transfer money globally and deposit money to multiple brokers including Jiaxin.
- Features: Compared with traditional bank transfer and remittance services, the interface is friendly, global coverage, local bank withdrawal supports multiple currencies, fast speed, low fees, and is more suitable for large international remittances.

Interactive Brokers (IBKR)
- Function : Interactive Brokers provides a comprehensive trading platform that supports trading of stocks, options, futures, forex, bonds and other assets, suitable for active traders and institutional investors.
- Features : Low commission, multi-market access, powerful trading tools.

BiyaPay makes crypto more popular!
Contact Us
Company and Team
BiyaPay Products
Customer Services
Resources
Telegram digital currency community:
https://t.me/BiyaPay666
Community


Sign In
Sign Up
Sign In
Sign Up
Regulation Subject
BIYA GLOBAL LIMITED registered as Financial Service Provider (FSP number: FSP1007221) in New Zealand, and is a member of the Financial Dispute Resolution Scheme, a New Zealand independent dispute resolution service provider.
BIYA GLOBAL LLC registered with the US Financial Crimes Enforcement Network (FinCEN), as a Money Services Business (MSB), registration number: 31000274115551, and regulated by FinCEN.
BIYA GLOBAL LLC To enhance investor protection, BIYA GLOBAL LLC is expediting its Broker-Dealer license application process in full compliance with U.S. SEC and relevant regulatory requirements.
©2019 - 2025 BIYA GLOBAL LIMITED