
- Remittance
- Exchange Rate
- Stock
- Events
- EasyCard
- More
- Download


U.S. and Japanese stocks have crashed! The correction is far from over—can Hong Kong stocks benefit?

Published on 2024-08-06 Updated on
2024-11-04


US stocks plummeted
Last Friday, all three major US stock indexes fell sharply. Intel fell 26%, the largest drop since at least 1982, and Amazon fell 8.78%, leading the Dow Jones Industrial Average. Since mid-July, the Nasdaq has fallen sharply for three consecutive weeks, with a retracement of more than 10% from its peak. Meanwhile, long-term US government bonds rose 3.12%.
The recent decline in the US stock market is mainly due to multiple factors such as the continuous decline in US economic data, lower-than-expected AI monetization, high overall valuation of the US stock market, and poor performance of leading companies in the financial report season. At the same time, all these fluctuations are due to the just-released July unemployment rate data. According to the July employment report just released by the US Bureau of Labor Statistics, the US unemployment rate reached 4.3% in July, an increase of 0.2 percentage points from 4.1% in June, setting a new record since October 2020 and causing market panic. Although the 4.3% unemployment rate is not historically high, the recent upward trend has made the market very uneasy and worried about entering a recession, because the unemployment rate is not a leading indicator. The rise in the unemployment rate does not indicate that the market may be about to enter a recession, but rather that the market may already be in a recession. Therefore, although the unemployment rate has only increased by 0.2 percentage points, it is enough to make the market panic.
The rising unemployment rate data has triggered the Sam’s Rule, an indicator used to predict recessions. Its specific rule is that if the unemployment rate (based on the three-month Moving Average line) rises by 0.5 percentage points from last year’s low point, then an economic recession has begun. The indicator has been accurate in predicting since 1970. Bloomberg analysts said, “The Sam’s Rule has been triggered, and the US is not moving in a good direction.” Although the Sam’s Rule is “a statistical law that does not necessarily mean what will happen,” the turning point of market sentiment has already arrived before the recession.
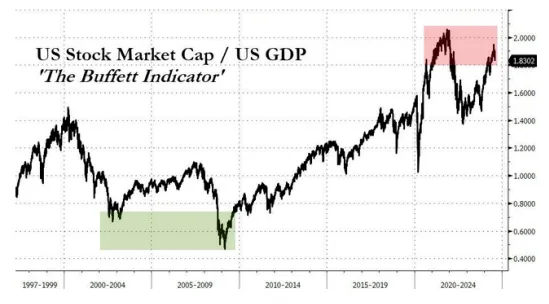
Buffett was the first to send a pessimistic signal to the market. The Buffett indicator (the ratio of total stock market value to GDP), which reflects whether the market is overheated, has now soared above 180%, indicating that the market is seriously overvalued.
What’s next for the US stock market?
After the release of employment data, Fed Watch data showed that the probability of the Fed cutting interest rates by 25 basis points and 50 basis points in September was 26% and 74%, respectively, compared to 78% and 22% in the previous period.
Looking at the reaction of major asset classes, the yield of 10-year US Treasury bonds fell sharply below 4%, a new low since February; the US dollar index fell back to 103.223. Gold rose first, then fell and then rose again. The three major US stock indexes all fell sharply, showing obvious recession trading characteristics.
If we choose the interest rate cut cycles of 1995, 2001, 2007, and 2019 as a review, these four interest rate cut cycles each include two rounds of recession-style interest rate cuts and two rounds of preventive interest rate cuts. The former is accompanied by a rapid cooling or recession of the economy, with a fast and large pace of interest rate cuts; the latter is a slow or small pace of interest rate cuts as the economy moves from overheating to normalization.
Only for the US interest rate cut transaction, there are two elements: first, referring to the first interest rate cut. Second, it is divided into two stages: transaction interest rate cut expectations (the time frame is 3 months before the interest rate cut, during which the probability of interest rate cut rapidly increases from below 50% to nearly 100%); transaction interest rate cut implementation (the time frame is 6 months after the interest rate cut, after 6 months, the market can roughly understand the rhythm and magnitude of the Fed’s interest rate cut). Interest rate cut transactions or short-term transactions that are more event-driven, if a longer time frame is framed, it is inevitable to confuse it with fundamental transactions and be more affected by other factors.
As far as the overall US stock market is concerned, in the preventive interest rate cut, the US stock market can “pull out the valuation” and drive the index up during the expected and implemented stages of the transaction interest rate cut; or the valuation remains stable, and the profitability resilience of the molecular end supports the index to rise. That is to say, due to the strong resilience of individual enterprises (i.e. the molecular end) in profitability, they can still achieve stable profits under unfavorable economic or market conditions. This stability and profitability enhance investors’ confidence, thereby promoting the rise of the overall market index. This situation usually indicates that the market is optimistic about the future performance expectations of these enterprises, which promotes the rise of stock prices and then drives the rise of the overall index.
In the recession-style interest rate cut, the US stock market fell in both stages, both of which were “killing valuations”. (“Killing valuations” refers to the process of the market significantly lowering the expected value (i.e. valuation) of certain stocks, industries, or assets. This process is usually accompanied by a sharp drop in stock prices. “Killing valuations” reflects the market’s pessimistic expectations for the future prospects of specific assets or industries, leading to a significant decline in their valuations.)
US Treasury: Whether it is a preventive or recessionary interest rate cut, the long-term US Treasury interest rate is significantly lower in both stages of the interest rate cut transaction. In a recessionary interest rate cut, because the short-term interest rate drops faster, the US Treasury term spread does not change much in a preventive interest rate cut.
US Dollar Index: In the preventive interest rate cut, the US dollar fluctuates weakly in the expected stage of the transaction interest rate cut, and the US dollar fluctuates strongly after the interest rate cut is implemented. In the recession interest rate cut, the US dollar is weak in the expected stage of the transaction interest rate cut; after the interest rate cut is implemented, the strength of the US dollar is uncertain. The closer the interest rate cut point is to the early stage of the recession, the stronger the US dollar may be due to hedging needs.
Gold: Whether in preventive interest rate cuts or recession-style interest rate cuts, in the two stages of interest rate cuts, gold is basically a strong trend of shock.
Nikkei is also affected
On August 5th, the Nikkei Stock Average fell sharply in the Tokyo stock market. The Nikkei Stock Average closed down 4451 points (12%) from August 2nd last weekend, closing at 31458 points. This drop is the largest drop in the Japanese stock market, surpassing the record of 3836 points after the US stock market crash on October 20th, 1987. Market participants such as overseas institutional investors, hedge funds, and individual investors all sold. The Nikkei index has fallen below the Closing Price (33464 points) at the end of 2023, wiping out all gains in 2024. Nevertheless, some believe that there is still room for further decline, and the market chaos continues.
Stock analysts at securities companies calculated the Nikkei Stock Average, which makes up the overall Price-To-Earnings Ratio (PER) of stocks based on expected profits for the 2024 fiscal year (until March 2025), at 14.9 times on August 2, lower than the average level of 15 times for long-term rising trends since Abenomics. Shingo Inoue of the Japan Institute of Life Sciences said, “From a valuation perspective, the current price is relatively cheap, and it is not surprising even if it stops falling. However, if the US stock market falls sharply again, the Japanese stock market may be affected.”
How do Hong Kong stocks perform during the Fed’s interest rate cut cycle?
According to Statistical Data from ICBC International, during the various interest rate cuts in the Hong Kong stock market since 1983, the average increase of the Hang Seng Index was 22.0%, with a cumulative increase of 264.2%. Both the average and cumulative increases are higher than the interest rate hike cycle.
However, from the recent rounds of interest rate cuts, the rise of Hong Kong stocks has shown a significant decline, which shows that loose liquidity has a decreasing stimulating effect on Hong Kong stocks.
Breaking down stock price changes, we can see that the main driving force behind the rise in Hong Kong stocks during the interest rate cut phase has shifted from profit growth to valuation expansion.
Looking at the interest rate cuts since 1993, the Hang Seng Index Price-To-Earnings Ratio has expanded by an average of 20.9% and a cumulative expansion of 125.3%. During the interest rate cuts, the average profit growth of the Hang Seng Index was 12.8% and the cumulative growth was 77.0%.
It can be seen that during the interest rate cut phase of Hong Kong stocks, profits can also maintain growth, but the increase is not as significant as the expansion of valuation, nor is it as significant as the profit growth during the interest rate hike phase.
Overall, in the interest rate cut stage, Hong Kong stock valuations and profits can maintain an increase, and valuation expansion has become the main driving force for Hong Kong stocks to rise .
ICBC International stated that the reason why the performance of the Hong Kong stock index is relatively high in response to interest rate cuts is The main reason is that the Hong Kong stock market is in the offshore US dollar market, and the valuation is more sensitive to changes in US dollar liquidity. In addition, the Hong Kong stock market’s emphasis on the financial industry also makes Hong Kong stock profits more responsive to changes in interest rates than US stocks. Of course, the triggering factors and timing of interest rate cuts may have a significant impact on ROI. Therefore, scenario analysis before interest rate cuts is also crucial.
Excluding extreme events, this week will be a watershed moment for the Hong Kong stock market: to see whether to continue to follow the weakness of the periphery or stabilize and start a rebound.
Summary
If investors can trade both US and Hong Kong stocks on one platform, it will undoubtedly greatly improve the convenience and efficiency of operations, help improve investors’ operational efficiency, reduce costs, improve the accuracy of investment decisions, and achieve better ROI. Currently, there are platforms available on the market such as Tiger Securities, Kraken Exchange, and BiyaPay multi-asset trading wallet. These platforms ensure investors’ fund security through multi-country financial licenses, as well as special services such as deposit and withdrawal without freezing cards, providing investors with better choices beyond traditional securities firms.

BiyaPay makes crypto more popular!
Contact Us
Company and Team
BiyaPay Products
Customer Services
Resources
Telegram digital currency community:
https://t.me/BiyaPay666
Community


Sign In
Sign Up
Sign In
Sign Up
Regulation Subject
BIYA GLOBAL LIMITED registered as Financial Service Provider (FSP number: FSP1007221) in New Zealand, and is a member of the Financial Dispute Resolution Scheme, a New Zealand independent dispute resolution service provider.
BIYA GLOBAL LLC registered with the US Financial Crimes Enforcement Network (FinCEN), as a Money Services Business (MSB), registration number: 31000274115551, and regulated by FinCEN.
BIYA GLOBAL LLC To enhance investor protection, BIYA GLOBAL LLC is expediting its Broker-Dealer license application process in full compliance with U.S. SEC and relevant regulatory requirements.
©2019 - 2025 BIYA GLOBAL LIMITED